AI MARKET SCANNING
QUANTITATIVE COGNITION FREE PREVIEW TIER

TRADE WITH ALGORITHMIC CERTAINTY

Stop guessing market earnings. Our machine learning engine analyzes 500+ volatility and institutional order-flow signals to predict breakout directions with verified precision.

⚡ Live Radar 24/5 : Real-time trade executions & alerts
🎯 Dynamic Trailing Stop : Mathematical capital protection
🌐 6 Global Markets : Wall St, Europe, UK, Asia, Forex & Commodities
51.9% 30 Days: 49.7%
Audited Win Rate (2026)

Calculated across 7151 verified institutional market setups.

LIVE ACTIVE QUANTITATIVE ENGINES (7 MULTI-MODELS)
📈
XGBoost Equities Core random_forest_model.json
x2
Target: +13.0% Risk: -10.0% BE: +1.5%
💱
XGBoost Macro Forex forex_model.json
x30
Target: +8.8% Risk: -5.0% BE: +1.8%
🪙
XGBoost Commodities 24/7 commodities_model.json
x20
Target: +16.0% Risk: -10.0% BE: +1.5%
⚡ TACTICAL EQUITIES SUB-ROUTINES (INTRADAY & SWING RUNNERS)
💥
Gap & Hold Overnight Jump
TP: +11.7% SL: -10.0%
🚀
Drift Momentum Trend Surfing
TP: +14.0% SL: -10.0%
🎯
Drift Pullback Mean Reversion
TP: +8.5% SL: -12.0%
✨
Combo Runner Multi-Day Hold
TP: +26.0% SL: -15.0%

⚡ Parameters dynamically adjusted by Walk-Forward Machine Learning every 24h.

HIGHEST AUDITED WINNER EXECUTION SETTLED // Nov 20, 2026
🏛️ US COMPOSITE
MATW
$MATW Matthews International Corporation
🧠 XGBoost Equities Core 💥 GAP EXECUTION ▲ BUY x2
NET CAPTURED ALPHA +6.86%
ENTRY $19.41
→
EXIT $20.80
DURATION ⏱️ 21h 39m
UNLOCK NEXT LIVE SCAN ⚡ Next high-conviction setup queued in radar
🎯 VERIFIED ALGORITHMIC AUDIT

🏆 RECENT LIVE RADAR WINNERS // INTERACTIVE EXECUTION REPLAY

$MATW Matthews International Corporation
+6.86%
ENTRY: $19.41 ⏱️ 21h 39m EXIT (+6.86%): $20.80
VERIFIED REPLAY
STEP 1 / 2 : PRE-TRADE DRIFT Rewinding market history before execution…
STRATEGY 🎯 PULLBACK
ORDER DIRECTIVE ▲ BUY x2
HOLD TIME ⏱️ 21h 39m
EXECUTION DATE Nov 20, 2026
$ADI Analog Devices, Inc.
+5.73%
ENTRY: $381.67 ⏱️ 21h 14m EXIT (+5.73%): $369.52
VERIFIED REPLAY
STEP 1 / 2 : PRE-TRADE DRIFT Rewinding market history before execution…
STRATEGY 🚀 MOMENTUM
ORDER DIRECTIVE ▼ SELL x2
HOLD TIME ⏱️ 21h 14m
EXECUTION DATE Nov 20, 2026
$IESC IES Holdings, Inc.
+5.23%
ENTRY: $167.00 ⏱️ 1h 4m EXIT (+5.23%): $162.13
VERIFIED REPLAY
STEP 1 / 2 : PRE-TRADE DRIFT Rewinding market history before execution…
STRATEGY 🎯 PULLBACK
ORDER DIRECTIVE ▼ SELL x2
HOLD TIME ⏱️ 1h 4m
EXECUTION DATE Nov 20, 2026
$GRE.MC Grenergy Renovables S.A.
+4.95%
ENTRY: €54.00 ⏱️ 23m EXIT (+4.95%): €52.50
VERIFIED REPLAY
STEP 1 / 2 : PRE-TRADE DRIFT Rewinding market history before execution…
STRATEGY 🎯 PULLBACK
ORDER DIRECTIVE ▼ SELL x2
HOLD TIME ⏱️ 23m
EXECUTION DATE Nov 20, 2026
🔒

LATEST HIGH-CONVICTION PRO SIGNAL AVAILABLE

A new 84.6% Confidence Setup has just been confirmed in the Pre-Execution Pipeline. Unlock Pro to view target entry price and automated trailing stop.

$█████ BUY @ $██.██ TP: +40.0%
DECRYPT SIGNAL →
DAILY DISPATCH

📰 Latest AI Market Analysis

View All Reports →
Equity Markets
Nov 20, 2026

Portfolio Strategy: Analyzing the Market Gaps and Earnings Gaps

Comprehensive analysis of support/resistance levels, volume flow, and RSI/MACD divergence in the equity markets to generate actionable trading setups.

DE
Finance🇺🇸 WALL STREET
Nov 20, 2026

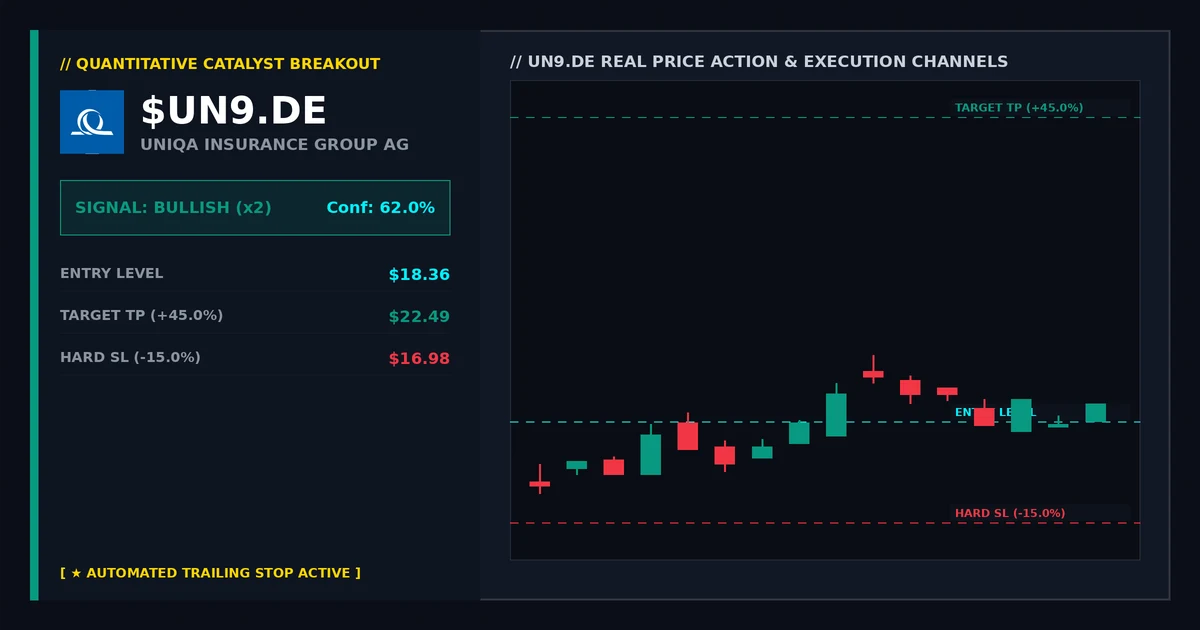
Sector Rotation: UN9.DE (Finance) as a Catalyst

Analyze UN9.DE (Finance) for sector rotation with support/resistance, RSI divergence, institutional volume flow, and actionable bullish setup.
Educational
Nov 20, 2026

Educational Guide to Trading Overnight Gaps and Price Action

An educational guide covering the technical aspects of trading overnight gaps, including support/resistance levels, institutional volume flow, RSI and MACD divergence.

UQA.VI
Finance🇪🇺 EUROPE
Nov 20, 2026

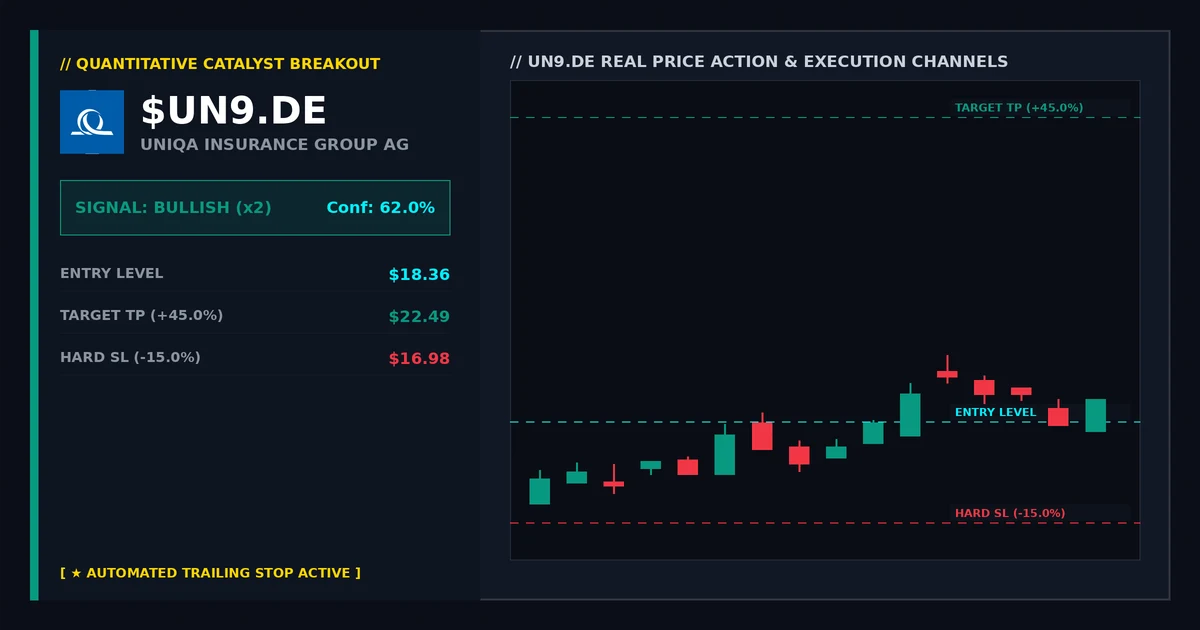
Daily Champions: Analysis of UN9.DE and UQA.VI with IESC as Bearish Counterpart

In-depth analysis of UN9.DE and UQA.VI, highlighting their strong support from institutional volume flow and bullish technical indicators.

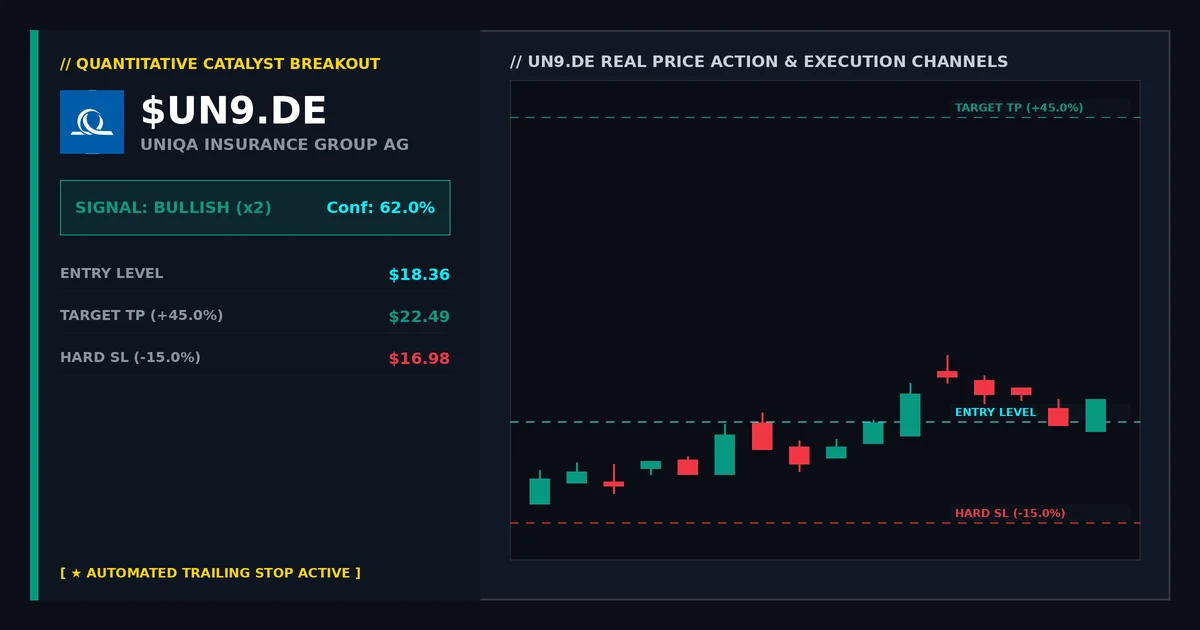
UN9.DE
Finance🇪🇺 EUROPE
Nov 20, 2026

$UN9.DE: A Comprehensive Analysis of Technical Levels, Institutional Volume Flow, and Divergence Patterns

Analyze UN9.DE’s earnings gap using technical levels, RSI, MACD divergence and institutional volume flow in this comprehensive market analysis.

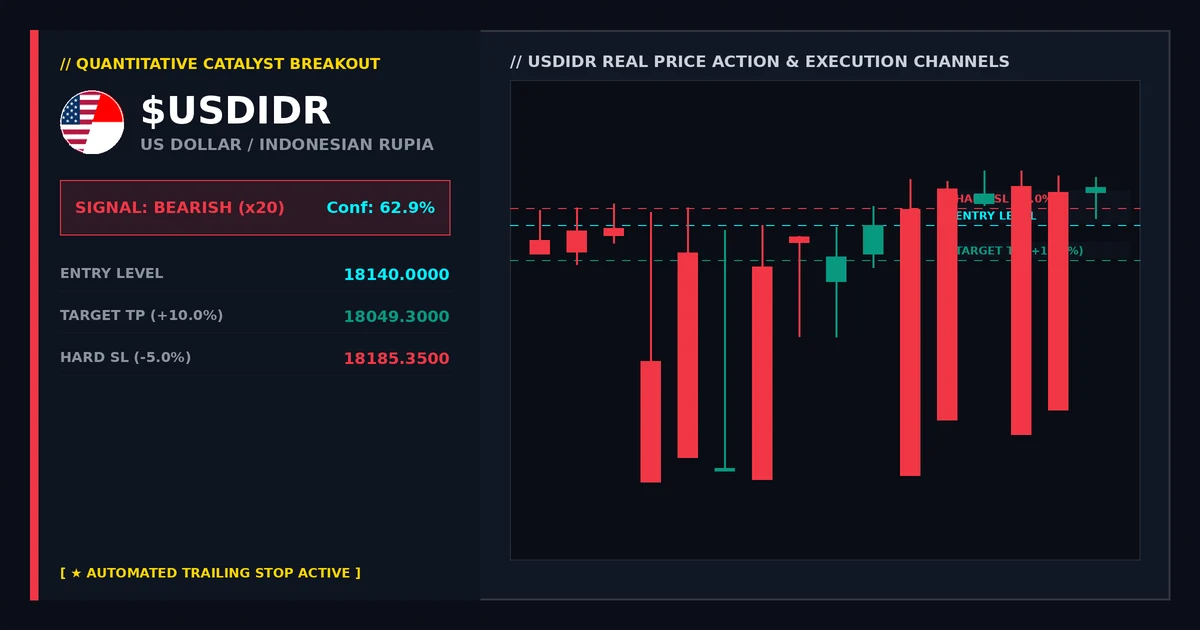
GOLD
Equity Markets🪙 COMMODITIES
Nov 19, 2026

Equity Markets React to AI Earnings Gaps and Gold Price Action

Analyze earnings gaps, support/resistance levels, institutional volume flow, RSI, and MACD divergence in equity markets.

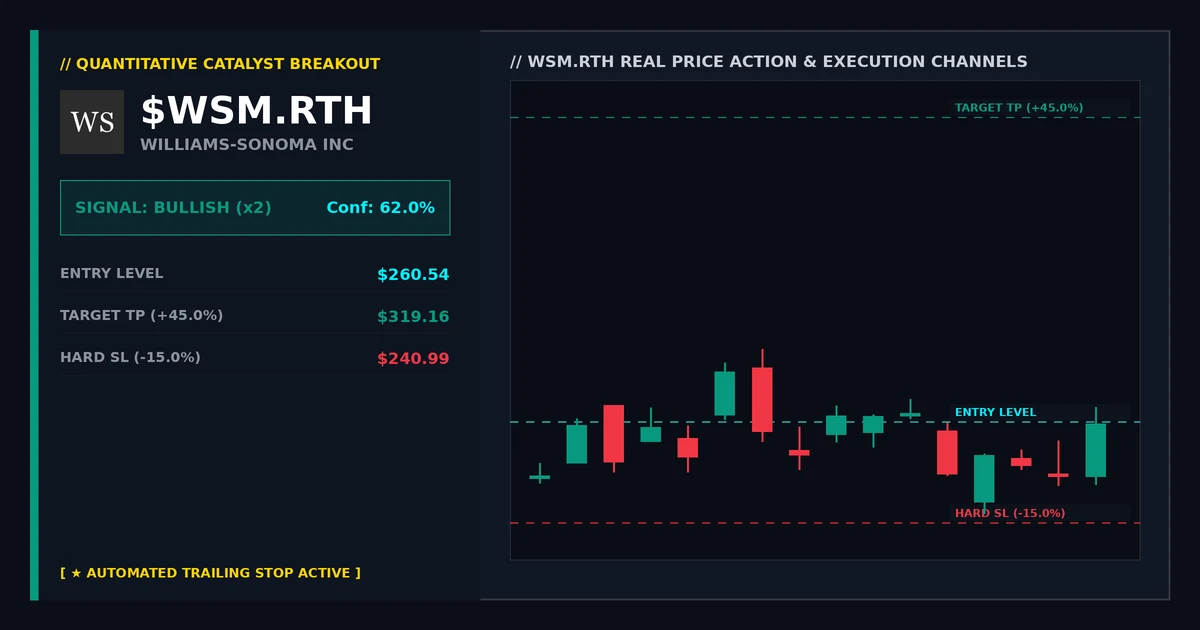
WSM.RTH
Technology🇺🇸 WALL STREET
Nov 19, 2026

$WSM.RTH: A Detailed Analysis of Support and Resistance Levels

Detailed analysis of sector rotation in the Technology sector, focusing on WSM.RTH stock’s bullish setup based on price action, RSI divergence, and…
Educational
Nov 19, 2026

Educational Guide to Trading Overnight Gaps and Price Action

An educational guide on earnings gaps, price action, and technical indicators for trading strategies.


SECTOR INTELLIGENCE

MARKET MOVERS & SECTOR PULSE

EXPLORE GROUPS →
🔒
📈 Top Mover (Gap)
Aytu BioPharma, Inc.
+46.15%
🔒
📉 Worst Drop (Gap)
Sable Offshore Corp
-68.81%
⚡ Recent Activity
  • Producer Manufactu -8.22%
  • Stocks +2.33%
  • Industrials +4.61%
  • Transportation +0.51%
  • Consumer Defensive -2.56%